In order to carry out a scientific analysis of meteor activity on a global scale, the IMO needs to store observational data in the Visual Meteor Data Base (VMDB). The Visual Observing Form allows you to record all the necessary meteor and watch data. If important data are missed, or obvious errors made, your observation cannot be used for a full, scientific analysis. As long as the field record of your observation is complete, you can do this work as soon after the watch as you have free time. Once completed, your report should be submitted to the IMO immediately. Please send in your visual observations through the online Visual Observation Report Form (registration required).
Interval analysis
Dividing the observation period into intervals
If your observation period lasted longer than 3~hours, you should divide it into intervals of 1.5 to 2.5 hours’ duration. The interval boundaries must coincide with any time labels reported in your notes (breaks included).
Intervals should not be shorter than 1 hour unless you had to stop your watch due to other reasons like clouds. If you observe a major-shower maximum, periods should also be shorter than 1 hour. There is no need to report intervals of exactly 1 hour duration. If circumstances change considerably and quickly (e.g. change of limiting magnitude by more than 0.5mag) take the time of such a change as an interval boundary. Typical period lengths for a major-shower peak are 15 minutes instead of 1 hour.
Next, on the back of the Visual Observing Form you will find three equal-sized tables, and thus you have space for three intervals per form. If you have more than three intervals to report, use an additional form. As an example we will use the case of Section 5.7. This observation lasted from 20h 12m – 22h 02m UT, and we record this in the first line of the interval analysis.
Limiting magnitude
The second table is for the limiting magnitudes. Fill in the times, field numbers (‘Nr’), and numbers of stars (‘N’) seen during your watch. Then, using the conversion table you must find the corresponding limiting magnitude (lm). As you can see, the lm obtained in field Nr. 1 in our example differs considerably from that in the other fields. Looking at the conversion table we find that the 10th star in field 1 is of magnitude 5.3 and the 11th one of magnitude 6.0. Although the limiting magnitude is 5.85 as determined using fields 7 and 15, only 10 stars in field 1 were seen which would correspond to lm = 5.3mag, since there is no star of 5.8mag and the one of 6.0mag cannot be seen. Field 1 should thus not be used in this case. Now, the reason for using three fields to determine the limiting magnitude becomes clear, as there are similar cases in some of the other fields. Whenever your limiting magnitude lies in a ‘gap’ wider than 0.3mag, you should ignore this field. When all the limiting magnitudes have been determined, you can calculate the weighted average (lm_avg). Do not compute the average number of stars: only magnitudes themselves can be averaged.
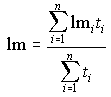
where t_i is the time for which lm_i is valid. In our example lm_1 = 5.85mag is valid from 2012-2036 (2036 is in between 2012 and the next lm check made at 2100 hours). This results in t_1 = 24 minutes. lm_2 = 6.1mag is valid from 2036-2115. With a break of 6 minutes (2050-2056) we find t_2 = 33 min.
            5.85 mag 24 min + 6.1 mag 33 min + 6.07 mag 47 min
     lm   = -------------------------------------------------- = 6.03 mag
       avg                24 min + 33 min + 47 min
This procedure can be somewhat cumbersome, especially where the lm is very variable, but simple averaging is usually possible in most cases.
Cloud cover or field obstructions
Now we can fill in the third table. Here we need to compute the weighted average cloud cover. Multiply every percentage k by its corresponding time interval in minutes. These products are then totalled, and their sum is divided by the total observing time, also in minutes, and by 100 to give a percentage:
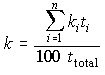
In our example t_total between 2012-2202 equals 110 minutes minus 6 minutes (break), which equals 104 minutes.
         10 % 9 min + 20 % 4 min
     k = ----------------------- = 0.016
              100 % 104 min
k is the average part of the field covered by clouds during the entire watch. The final correction factor results from:
             1
     F = ---------
           1 - k
In our example:
             1
     F = --------- = 1.02
         1 - 0.016
Note that only obstructions of the field of view are reported. The field has a diameter of roughly 100 degrees.
Because of the reduced vision at the periphery of the field of view, clouds at the edge have a negligible effect on your meteor numbers; please take care that F is not overestimated.
Net observed time T_eff
Having filled in the “Breaks” table, the last but one line of the form starts with “Time for plotting”. See the minor-shower observation page for details about plotting. If you were not plotting meteors leave this blank, as in our example. At the end of this line fill in the total of any breaks. The net observed time then naturally results from the time span start-end minus the total duration of the breaks. In our example:
20h 12m - 22h 02m --> 110min minus 6min, T_eff = 104min = 1.73h.
Give T_eff in hours and decimals of an hour, not minutes.
T [in h] = T [in min] / 60
Every interval of your observation should be processed in this way.
Summary report
Back on the front of the form we find the following items:
- Date: In order to avoid confusion, use the double date if the start was before and the end after 0h UT; e.g. for a watch running between 2215-0015 UT starting on 2012 December 12, the double date would be written as “Date: 12-13 (day), 12 (month), 2012 (year)”. Always use your local-time double date.
- Start: start of the first interval.
- End: end of the last interval.
- Location: Report the geographic longitude and latitude of your observing site as accurately as you know them. E/W means east or west of Greenwich meridian, N/S means north or south of the equator. Several online services (such as Google) give latitude/longitude; note that we use longitude/latitude. Once your first observations have been submitted, the IMO will give your site a code number. If you do not know the code number, for example if you are using a new site, leave this blank.
- Place: Report the name of your observing site. Give the nearest town or village name.
- Observer: Fill in your first and last names. The IMO observer code consists of the first three letters of your last name and the first two letters of your first name. As an example, the code of observer Fritz Schmidt would be SCHFR. If the code exists already for somebody else, or if technical reasons require it, the last letter may differ from this rule.
Observed showers
This table needs to contain:
- The IMO three-letter codes of the showers observed.
- The radiant positions in right ascension and declination valid for the date of the observation (remember to allow for the radiant drift). This information can be found in the Shower Calendar.
Observed numbers of meteors per period per shower:
Use one line for each interval.
- Period (UT): Report the start and end of the interval (in UT).
- Field: Fill in the coordinates of the center of your field of view with a accuracy of about 10° . In our example the star delta Cep was reported. From a star atlas we find the corresponding coordinates alpha = 335° , delta = +60° .
- T_eff, F, lm: Fill in the quantities obtained during the interval analysis.
The next set of columns are designed for reporting the observed numbers of shower meteors and sporadics. At the top fill in the appropriate IMO three-letter codes of the showers you observed.
- M: observing method. Fill in “C” for “counting” if you “counted” the meteors without plotting them onto charts or recording their sky coordinates. Use “P” if you were plotting meteors.
- N: number of shower meteors observed during the interval.
If there was more than one interval to your watch, fill in the data from the subsequent intervals in the subsequent lines.
Magnitude distributions:
This table is for reporting the number of shower meteors and sporadics per magnitude class. Again, fill in the IMO three-letter shower code and then on the same line, give the numbers of meteors seen in each magnitude interval. Unless you have seen more than about 100 shower meteors these are totals for the entire observation, not for each interval.
If a meteor was, for instance, of magnitude +4.5, count it as being half in the magnitude class +4 and half in +5. In the end, magnitude classes with half meteors may remain. But in one distribution, such half meteor occurrences should be of an even number.
In the last column, “Tot” (short for “Total”), give the sum of the numbers for the entire line. As this sum must be equal to the sum of the numbers of shower or sporadic meteors for all the intervals reported in the previous table, an easy check can always be made, and any errors rectified at this stage. In our example, 21 Perseids were observed in the first interval, 24 in the second, and 30 in the third. Thus the total for the Perseids must be 75.
Important Notes:
- If the number of meteors for the most active shower exceeds 30 for the whole observation, you should report a series of separate magnitude distributions, rather than the global one we have discussed so far. To do this, find out how many intervals contained more than about 30 meteors for this shower and then construct an individual magnitude distribution (including both sporadics and all observed showers, not just this most active shower) for each such interval. If no single interval contains 30-plus shower meteors, then combine neighboring intervals to achieve this. For example:
- Interval 1: 10 Geminids
- Interval 2: 18 Geminids
- Interval 3: 10 Geminids
- Interval 4: 17 Geminids
- Interval 5: 23 Geminids
Here you should report one separate magnitude distribution for the combined intervals 1 and 2, another one by combining the intervals 3 and 4, and a separate distribution for 5.
- If the limiting magnitude of two adjacent intervals differs by more than 0.5mag you should not incorporate the meteors seen into one magnitude distribution. In this case, it is more useful to report a separate magnitude distribution for each interval. If we use the following data for the Geminid example above, it is clear we cannot combine the intervals quite as easily as just looking at the meteor numbers alone:
- Interval 1: lm = 6.3mag
- Interval 2: lm = 6.1mag
- Interval 3: lm = 5.7mag
- Interval 4: lm = 5.6mag
- Interval 5: lm = 6.2mag
This time, magnitude distributions could reasonably be derived for the combined intervals 1 and 2, 3 and 4, and a third for interval 5.
When reporting more than one magnitude distribution, add a separate sheet of paper on which you report these extra magnitude distributions. Please be sure to add your name or IMO observer name code and the observation’s date, and also indicate to which interval(s) each magnitude distribution belongs on the additional sheet. Remember to note on the form that you have given additional magnitude distributions on another sheet.
Mailing the report forms
The preferred way of reporting is through the online Visual Observation Report Form (registration required) which is checked for consistency and immediately sent to the IMO. Alternatively, you may also send an informal e-mail message to Rainer Arlt at visual@imo.net with a report similar in style to the electronic form. Do not wait until the end of the year before submitting your results.