There is a double-sided standard form: PDF (32KB).
Observations may also be submitted electronically as plain text file, provided the same basic layout and information is provided. Special characters for accents and formatting, and tabs should be avoided.
General remarks
- All times must be in Universal Time (UT).
- Use a double date even if your observations do not span midnight UT, for instance 1992 Oct. 24/25. There is an exception if the watches span 12h UT where a double date is ambiguous.
Before observing
Chart
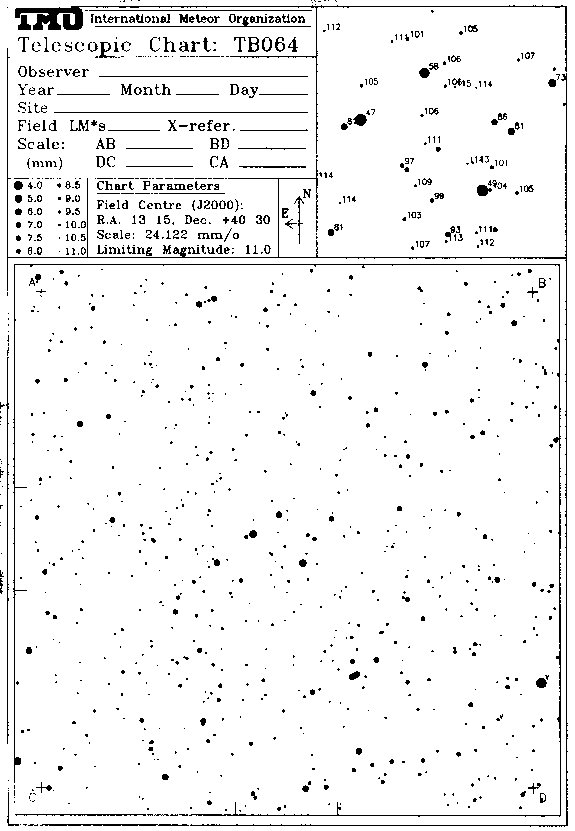
- A chart may be used for more than one watch during a given night, but not for more than one night. So you can observe one field, go to another, and then return to the original field, and only use two charts. Charts are available as PDF files.
- You will notice that in the corners of the main chart are four crosses labelled A, B, C, D. These are provided because photocopiers do not necessarily reproduce at one times magnification, and different paper sizes. Before or after the watch you should measure the separation of these corners horizontally and vertically, and enter the four lengths in area marked “Scale:”. Try to measure to the nearest 0.1mm so that there is no artificial error caused by rounding. Astrometry indicates that a typical measuring error is ±0.15mm.
- Stars labelled V are variable stars and should not be used to estimate the meteor magnitudes. The relative sizes of stars indicate their magnitudes for comparison purposes on a linear scale, and is calibrated by the key to the top-left.
- “Field LM*s” is for the name of the faintest star visible in the field whose numerical value is unknown. The inset is provided for you to estimate the field limiting magnitude and goes 0.5 magnitudes deeper than the main chart. The annotations are the magnitude times 10. You can estimate the naked-eye limit as it is more inter-comparable between instruments as a guide to sky conditions, though the quality of the optics and dewing affect the relative difference in the field over naked-eye limiting magnitudes, so given a choice try to determine the field limiting magnitude. Naming the faintest star should only occur because the star is outside the area of the inset chart or it is fainter than the chart’s limiting magnitude or not annotated. In these cases you circle a plotted star or mark the location of the faintest star, and then annotate with a letter X, Y, Z. Later this can be converted this to a magnitude.It would take considerably more effort to make regions on each chart where you count the number of stars to derive the limiting magnitude, as is normal for visual observations. If you prefer this method you can devise something similar yourself say by marking an area in the inset and counting the number of stars visible therein. Since the star brightnesses are known approximately (using the spot diameter for those not annotated for clarity) it should be possible derive a table of number versus magnitude for the area on that chart.
- The location of the inset is marked by pairs of tick marks on the left and bottom of the main chart.
- Since there are separate report sheets and charts, it is important that we have a cross-reference between them. “X-refer.” should be a unique string for each new chart. We usually use the IMO observer’s code followed by a sequence number: CURMA1, CURMA2, … for Malcolm Currie.
Form
- You do not need to enter both a latitude (phi) and longitude (lambda) every observation. Adding it periodically should suffice. The preferred method is even quicker, and that is to use an IMO site code. The IMO Visual Meteor Database has an index which translates IMO site code into named location and geographical co-ordinates. As yet you cannot query it from this Web site. A slightly out of date list is available. If its 155kb is too big to download, or you cannot find a location within a few kilometres of your observing site, contact the Director of the Visual Commission visual@imo.net) giving your site name, latitude, longitude and height above sea level. The Director will allocate a new number for your site, or if there is already a code for a site nearby, give you its number. Your geographical position is needed by the reduction software and will save you time filling the form.
- The instrument should give the type (examples include binocular, monocular, reflector) and aperture in millimetres.
- “True field” is the instrument’s field diameter in degrees on the sky.
- There is a place for the mean limiting magnitude for the whole night. Delete either “NE” or “Field” if you estimated a field or naked-eye limiting magnitude respectively.
- For each meteor watch you should record the details in the boxes, starting from the left. Data required are:
- the start and end times;
- the total duration of breaks (in minutes), but excluding the dead time (that’s the time when you are not actively observing meteors.) Beginners especially should should measure their dead time by operating an integrating stop watch during time away from the eyepiece. On average dead time for plotting and recording the meteor details should be around 30 to 45 seconds. Other data required are:
- the effective time in hours, which is the duration less breaks and the dead time;
- the chart number, such as TA018;
- the chart cross reference, which is the same string as used on the chart; and
- the limiting magnitude, which must be of the same type as earlier, either naked-eye or field.
When a meteor appears
When you see a meteor, freeze and replay what you have seen over in your mind. Only once you are sure of the meteors characteristics, switch on your dim red light and record the following:
- The meteor’s path against the star background on the chart. Use two well-separated pairs of stars. Each pair of stars should straddle closely to the meteor’s path. Estimate the fractional distance of the meteor’s path between the two stars in a pair, for example midway, or 30% from the lower to the upper star. Repeat for the other pair. After some practice you will find that this comes naturally, and it gives accurate results.
- In the first column there is a sequence number. On each night start from 1. You use the same number to annotate the meteor track on the chart.
- Note the time of appearance to the nearest minute.
- Give the estimated magnitude to the nearest 0.5.
- Velocity is a scale from A to F. A is the slowest, B is slow, C is medium, D is fast, E is very fast and F is the fastest. After a few watches you soon get a consistent set. Most will be C, D or E. Speed A is not common. A corresponds to about an unmagnified angular speed of 3° per second, and F is excess of 25° per second. Remember that these classes are for the magnified telescopic meteors and are not the visual equivalents. A `slow’ telescopic meteor would be a ‘fast’ visual meteor. For slower meteors it is also acceptable to record a speed in degrees per second. In that case enter the numeric speed instead of the letter code.
- Type is 11 if the meteor started and ended within the field of view; 00 if it started and ended beyond the field; 01 if it started outside, but terminated inside; 10 if it began within the field and left the field. An aide memoire is I for inside and O for outside.
- Reliability of the observation (“Rel.”) For a normal sighting, leave this blank meaning average reliability. If you saw the meteor very well and are highly confident of the parameters you have recorded, put a “1” here. Similarly, if it is an unreliable observation (for example meteor passed near the edge of the field, put a “3” in this column. The default is “2”. Normally this will be blank. The majority of meteors should be in category “2”
- Record the duration of persistent trains in seconds under “tr”.
- Any other remarks go in the final column, such as fragmentation, type of train. Persistent and unusual phenomena should be drawn on the reverse of the chart. This includes the changing form of a persistent train with each drawing annotated with the time elapsed since the meteor appeared. You can include provisional shower assignments if you wish, though the recommendation is only do this after the watch to avoid biases (except in special circumstances as might occur during a storm). If there is a pronounced colour you can add it there. Colour is so subjective it is not much use apart from identification of bright members of certain showers. For example, bright Quadrantids are often described as electric blue in appearance. To summarise: concentrate on plotting the path and estimating the magnitude accurately rather than recording the colour.
After observing
- During the day or on a cloudy night, please measure the start and end co-ordinates of the meteors tracks on the charts and enter them in the four remaining columns. The subscript “b” is for begin, and “e” for end. The x co-ordinate is measured from the left-hand side of the interior box containing the chart, and the y is measured from the bottom side. Note it is not the box that surrounds the whole sheet. Try to measure to no worse than ±0.5mm, to ensure that measuring errors are small compared with the plotting errors. If the observers help with the measurement it accelerates the reductions – divide and conquer!Given an x–y position on a chart, the chart number, the AB etc. distances, the software can derive the Right Ascension and Declinations of these points.
You may wish to note in the remarks column when you change charts. Please submit both the report sheets and the charts.